Most reflow failures begin before anyone touches the oven recipe.
The process engineer receives a new assembly, opens an old program, adjusts two zone temperatures, runs a golden board, and declares the profile “good” because the solder joints look shiny enough. That approach survives in factories because it is fast. It also creates intermittent defects that appear only after the line warms up, the paste ages, the PCB supplier changes, or a moisture-sensitive BGA enters the mix.
Profiles expose assumptions.
A valid SMT reflow profile must reconcile solder-paste chemistry, component temperature limits, PCB thermal mass, copper distribution, oven loading, conveyor speed, atmosphere, thermocouple attachment, inspection data, and the difference between the hottest and coldest joints on the same assembly.
So why do some factories still treat a nine-zone recipe as intellectual property?
Because oven settings are easy to copy. Process knowledge is not.
The “Perfect” Lead-Free Reflow Profile Is a Dangerous Myth
There is no universal best reflow profile for lead-free solder.
Texas Instruments states that a component manufacturer cannot provide one general production profile because actual oven settings depend on the number of heating and cooling zones, solder paste and flux, board dimensions, component size, and assembly density. TI also warns that the IPC/JEDEC J-STD-020 profile is used for package classification; the board-assembly recipe must be developed separately. ([Texas Instruments][1])
That distinction is routinely misunderstood.
J-STD-020 tells us what qualified components are expected to tolerate under defined classification conditions. It does not tell us that every QFN pad, BGA sphere, shielded module, and 2512 resistor on a production PCB will experience an acceptable soldering cycle when the oven display says 245°C.
The oven display is an input. The solder-joint temperature is the process.
For SAC305—nominally Sn96.5Ag3.0Cu0.5—the liquidus point is approximately 217°C. But merely crossing 217°C does not prove that the joint received enough thermal energy for oxide removal, coalescence, wetting, outgassing, and intermetallic formation. Nor does a 245°C peak prove that a nearby polymer connector stayed below its body-temperature limit.
The hard truth is uncomfortable: a profile can satisfy every visible textbook number and still produce poor assemblies.
Define the Process Constraints Before Programming the Oven
I would not begin with zone temperatures. I would begin with four documents:
- The solder-paste technical data sheet.
- Component peak-body and moisture-sensitivity limits.
- The PCB stack-up and copper-distribution data.
- The assembly defect history, including SPI, AOI, X-ray, ICT, and functional-test findings.
AIM’s lead-free profile guidance gives broad starting ranges for SAC alloys: ramp rates of 1–3°C per second, time above liquidus of 30–90 seconds, typical SAC peak temperatures of 230–250°C, cooling below 4°C per second, and roughly 3–4.5 minutes from 40°C to peak for no-clean materials. These are starting boundaries, not automatic acceptance limits. ([AIM Solder][2])
The operating window is then narrowed by the assembly itself.
A thin 1.0 mm controller board carrying 0201 passives behaves nothing like a 2.4 mm power board with heavy copper, large inductors, ground-connected QFNs, and a high-mass connector. The same recipe may drive the light board above 250°C while leaving the power pad of the QFN barely above liquidus.
That is not process control. It is thermal gambling.
Identify the limiting component
The limiting component is not automatically the largest package. It may be:
- A plastic connector with a low body-temperature limit.
- An MSL-rated BGA that has exceeded floor life.
- A ceramic component vulnerable to thermal shock.
- A bottom-terminated component on a heavy ground plane.
- A large shield or transformer that creates a cold shadow.
- A small passive next to an exposed copper area that heats rapidly.
TI’s J-STD-020-based tables show that allowable peak package-body temperatures can vary from 245°C to 260°C according to package thickness and volume. That 15°C difference can consume most of a lead-free production window. ([Texas Instruments][1])
Separate solder limits from component limits
The paste supplier defines the minimum thermal conditions needed to activate flux and form an acceptable joint. Component suppliers define maximum exposure conditions.
Your process must fit between them.
That gap is the real process window.
Build the Thermocouple Plan Around Thermal Risk
One thermocouple on an exposed copper pad is not a profile. It is a temperature reading.
For a normal mixed-technology PCB, I prefer a profile vehicle that captures at least these locations:
- The expected cold solder joint.
- The expected hot solder joint.
- A BGA or LGA sphere location.
- A QFN or power-pad termination.
- A small passive on low thermal mass.
- A connector or temperature-sensitive package body.
- A component near the leading board edge.
- A component near the trailing edge.
A complex power assembly may require ten or more channels. A small, thermally uniform board may need fewer. Channel count should follow risk—not habit.
Thermocouples must also measure the intended object. A bead floating above the pad records hot air. A wire fixed with an excessive blob of high-temperature solder creates an artificial heat sink. Adhesive tape can lift, insulate the junction, or allow the bead to move during repeated runs.
Attachment matters.
For solder-joint measurements, the junction should be mechanically secure and in intimate contact with the target pad or termination. For package-body limits, attach a separate thermocouple to the top-center surface specified by the component guidance. Do not confuse these measurements; they answer different questions.
And profile a populated assembly. A bare PCB coupon does not reproduce the airflow obstruction, heat capacity, shadowing, or thermal coupling of the real product.
How to Develop an SMT Reflow Profile Step by Step
Establish a conservative starting window
The table below is the starting window I would test for a conventional no-clean SAC305 assembly. It is deliberately narrower than the broad supplier limits so the process begins near the center rather than against an edge.
| Profile parameter | Engineering starting target | Broad reference boundary | What to investigate when missed |
|---|---|---|---|
| Average ramp to soak | 1.0–1.5°C/s | 1–3°C/s | Thermal shock, solder balls, flux spatter |
| Soak range | 150–200°C | Paste-specific | Board ΔT, volatile removal, flux exhaustion |
| Soak duration | 60–90 s | Commonly 30–90 s | Uneven heating, excessive oxidation |
| SAC305 liquidus | 217°C | Alloy property | Do not substitute oven-zone temperature |
| Time above liquidus | 45–75 s | Commonly 30–90 s | Wetting, voiding, IMC growth, flux life |
| Peak joint temperature | 235–245°C | Often 230–250°C for SAC | Cold joints below target; damage above target |
| Time within 5°C of peak | 10–25 s | Component-dependent | Package exposure and excessive thermal input |
| Average cooling rate | 2–4°C/s | Below 4–6°C/s, source-dependent | Grain structure, thermal stress, handling |
| 40°C-to-peak duration | 3.5–4.5 min | Typically 3–4.5 min | Flux depletion or incomplete equilibration |
| Maximum board ΔT near peak | Preferably below 10°C | Product-specific | Thermal mass imbalance or airflow problems |
These are not universal specification limits. They are centered development targets that must be checked against the paste data sheet, component documentation, and customer requirements. AIM’s published SAC guidance supports the broader TAL, peak, cooling, and total-duration boundaries shown here. ([AIM Solder][2])
Use conveyor speed before chasing every zone
Engineers often alter six or eight zone setpoints when a small conveyor-speed change would move the entire profile more predictably.
A slower belt generally increases total heat exposure, soak duration, TAL, and sometimes peak temperature. A faster belt reduces exposure. The exact response depends on oven length, zone power, airflow, board mass, and loading, so it must be measured rather than assumed.
My preferred sequence is:
- Set a progressive zone-temperature gradient.
- Run the instrumented board.
- Adjust conveyor speed to position the overall curve.
- Adjust early zones to control ramp and soak.
- Adjust final heating zones to control TAL and peak.
- Adjust cooling to control ramp-down without shocking the assembly.
- Repeat until every measured location fits the target window.
A multi-zone platform such as the Heller 2043 MK5 SMT reflow oven gives the engineer more control points, but additional zones do not automatically create a stable profile. Poor thermocouple data simply allow bad decisions to be made with greater precision.
Watch the thermal spread, not just the average
Suppose eight thermocouples produce peak temperatures between 236°C and 247°C. The average is 241.5°C. It looks excellent.
But one package is already at 247°C while one ground-connected termination is barely reaching 236°C. Increasing the final zones to improve the cold joint could push the hot package outside its process margin.
That 11°C spread is the actual problem.
The response may require a longer soak, more balanced upstream heating, reduced peak-zone aggression, altered conveyor speed, board support changes, airflow adjustment, or even a design review. Raising the last zone is the easiest response—and often the worst.
Time Above Liquidus Is Not a Stand-Alone Quality Number
Time above liquidus, or TAL, measures how long the solder-joint temperature remains above the alloy’s liquidus point. For SAC305, engineers normally calculate TAL above 217°C.
Thirty seconds and ninety seconds may both fall inside a paste supplier’s broad range. They do not create identical metallurgy.
Insufficient TAL can leave marginal wetting, incomplete coalescence, or cold regions that only briefly cross liquidus. Excessive TAL can consume flux, increase copper dissolution, thicken intermetallic compounds, stress components, and extend the thermal cycle without solving the original defect.
Older experimental work on SAC305 found that intermetallic thickness increased as peak temperature and TAL increased, reinforcing the point that “more heat” is not a free reliability margin. ([electronics.org][3])
AIM’s profile guidance is equally blunt about voiding: profile manipulation may produce modest improvement, while other variables can have a larger effect. Its guidance also notes that solder paste is approximately 50% flux by volume, so not all gaseous material can necessarily escape from every joint during reflow. ([AIM Solder][2])
In other words, do not use a longer soak or TAL as a ritual cure for every void.
Check stencil design, paste volume, aperture geometry, component standoff, pad finish, oxidation, paste handling, print speed, separation speed, and vacuum-reflow options where appropriate.
Connect SPI, Reflow, and AOI Instead of Managing Three Islands
Reflow profiling fails when the engineer treats every post-oven defect as a thermal defect.
Tombstoning can be influenced by unequal heating. It can also come from asymmetric paste deposits, pad geometry, component placement, solderability, or unequal copper connections. Bridging can arise during collapse in reflow, but excessive paste volume or print misregistration may be the upstream cause.
This is why an SPI system belongs inside the profile-development loop.
A 2023 industrial-data study analyzed SPI features from 6 million pins, representing 2 million components on 15,387 PCBs, to build defect-detection models at pin, component, and board levels. The scale of that dataset makes the practical point: print and inspection data contain process signals that cannot be recovered from one temperature curve. ([arXiv][4])
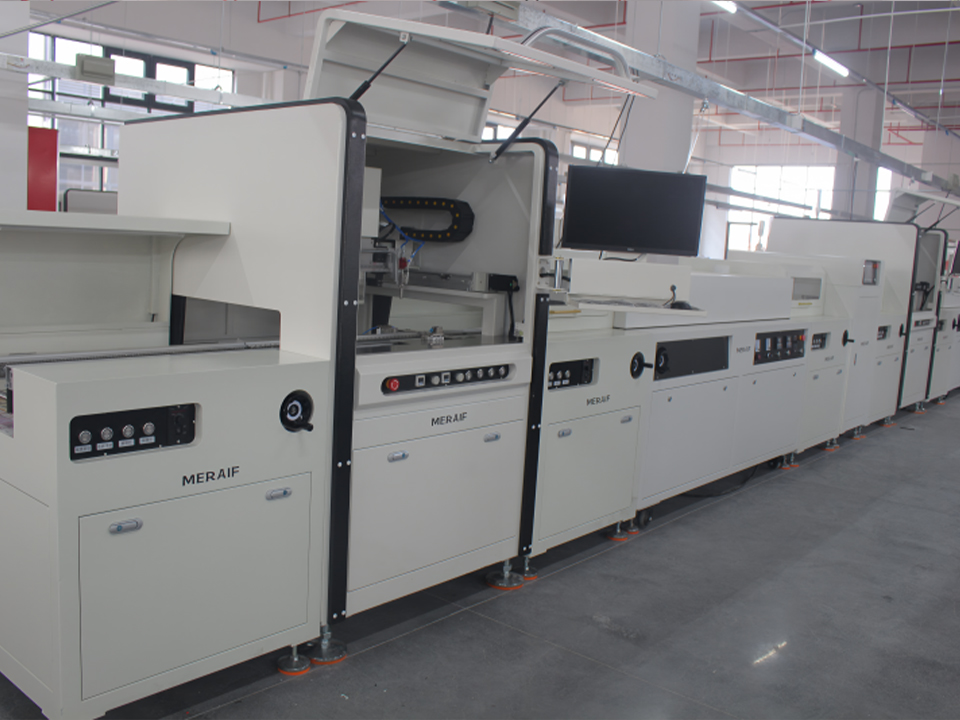
A system such as the Meraif S1 3D solder paste inspection machine can measure paste height, volume-related conditions, offsets, bridging, solder balls, and coplanarity indicators before the board enters the oven. Its value is not merely rejecting prints. The data help separate thermal causes from deposition causes.
Post-reflow AOI closes the other side of the loop.
For high-volume lines, the Meraif D1 automated optical inspection system can be used to screen opens, shorts, misalignment, and visible soldering defects after reflow. For assemblies where coplanarity and three-dimensional solder geometry matter, the MIRTEC MV-7XI 3D AOI platform adds 3D measurement and 2D color imaging for solder joints, presence, polarity, and bridging.
The sequence should be analytical:
SPI condition → placement condition → measured thermal profile → AOI/X-ray result → process adjustment
Not this:
AOI alarm → raise oven temperature
That shortcut burns process margin while hiding the real source.
Build a Process Window, Not a Beautiful Profile Screenshot
A single passing run proves very little.
The oven may be cold at the beginning of the shift. The measured board may have entered an empty oven. Production boards may run at 20-second spacing. Filters may be clean during qualification and partially loaded six weeks later. Factory ambient temperature, exhaust balance, nitrogen flow, rail width, board supports, and product spacing can all move the measured response.
A production-worthy profile should be challenged under realistic conditions:
- Cold start versus thermally stabilized oven.
- Empty chamber versus normal board loading.
- Minimum and maximum permitted board spacing.
- Normal conveyor-speed tolerance.
- Expected mains-voltage variation.
- Nitrogen and air operation, where both are permitted.
- New versus aged paste within the approved handling window.
- Multiple profile boards or representative production units.
- Repeated runs to expose measurement variation.
The profile is accepted only when the hottest and coldest monitored points remain inside their approved limits across these conditions.
Recent research is moving in the same direction. ReflowNet, published online on October 22, 2024, combines physics-based computational-fluid-dynamics data with real experimental trials to predict oven recipes while accounting for differences between simulation and production measurements. The researchers reported accurate recipe estimation with lower variance across recipe settings. ([Springer Nature][5])
I see that as confirmation of an old manufacturing truth: the curve is a system response, not a row of heater settings.
Machine learning may shorten tuning. It does not remove the need for calibrated thermocouples, representative boards, engineering limits, and inspection evidence.
Diagnose Reflow Defects Without Blaming the Oven for Everything
| Defect | Possible profile contribution | Non-profile causes that must be checked |
|---|---|---|
| Head-in-pillow | Inadequate overlap between paste melting and BGA warpage cycle; unsuitable peak-zone shape | Package warpage, oxidation, paste transfer, component storage |
| Tombstoning | Unequal heating or wetting speed across the two terminations | Paste-volume imbalance, pad design, placement offset, unequal copper |
| Solder balls | Ramp too aggressive, rapid solvent release, excessive soak | Slump, excessive paste, stencil underside contamination |
| Poor wetting | Low peak, short TAL, flux exhausted during long preheat | Oxidized finish, contaminated pads, weak flux chemistry |
| Excessive voiding | Volatiles trapped by an unsuitable ramp or soak | Aperture design, paste chemistry, pad geometry, component standoff |
| Grainy or dull joints | Marginal thermal input or unsuitable cooling | Alloy appearance, contamination, oxidation |
| Component damage | Excessive peak, dwell, ramp, or moisture-driven popcorning | MSL violation, improper baking, handling damage |
| Bridging | Excessive collapse or component movement during molten phase | Excess paste, print offset, placement error, pad design |
| Open QFN thermal pad | Cold center pad or inadequate TAL | Insufficient paste, aperture pattern, board warpage, contamination |
No single defect has one guaranteed profile cause.
AIM’s troubleshooting matrix connects profile variables with poor wetting, solder balls, tombstoning, voiding, head-in-pillow, component damage, and other defects, while explicitly warning that material and process variables can produce the same symptoms. ([AIM Solder][2])
That warning should be printed above every oven terminal.
Freeze the Recipe Only After Reflow Process Window Optimization
Once the profile is accepted, record more than the zone setpoints.
The controlled process record should include:
- Oven manufacturer, model, serial number, and line position.
- Zone setpoints and conveyor speed.
- Convection or blower settings where adjustable.
- Rail width, center support, and board orientation.
- Board spacing and production loading.
- Nitrogen flow and oxygen limit where applicable.
- Solder-paste alloy, flux chemistry, powder type, and lot controls.
- Thermocouple locations and attachment method.
- Ramp, soak, TAL, peak, time near peak, cooling, and board ΔT.
- Profile date, profiler serial number, and calibration status.
- AOI, SPI, X-ray, electrical-test, and cross-section evidence.
- Approved engineering limits and reaction plan.
And set requalification triggers.
Reprofile after oven maintenance, heater or blower replacement, conveyor work, rail changes, paste changes, PCB revisions, component-source changes, major copper-layout changes, new fixtures, line transfer, repeated defect excursions, or any alteration that can change heat transfer.
Do not wait for a customer return.
A 2024 study of alternative photothermal soldering reported that reducing process temperature from 245°C to 180°C cut measured warpage by 30% and energy consumption by 40%. That process is not a drop-in SAC305 recipe, but the result demonstrates how strongly thermal budget influences both deformation and manufacturing energy. ([ScienceDirect][6])
Heat is not free. Neither is margin.
Preguntas frecuentes
What is an SMT reflow profile?
An SMT reflow profile is a measured temperature-versus-time record showing how selected solder joints and component bodies heat, remain above the solder alloy’s liquidus temperature, reach peak temperature, and cool while a populated PCB travels through a reflow oven under defined production conditions.
The profile is normally evaluated through ramp rate, soak temperature and duration, TAL, peak temperature, time near peak, cooling rate, and temperature spread across the assembly. Oven-zone setpoints alone are not a profile because they do not prove what the board experienced.
What is the best reflow profile for SAC305 lead-free solder?
The best SAC305 reflow profile is the narrowest repeatable thermal window that meets the approved solder-paste specification, keeps every measured joint adequately above the 217°C liquidus point, prevents all component bodies from exceeding their limits, and produces acceptable SPI, AOI, X-ray, electrical-test, and reliability results.
A practical development target is often a 235–245°C joint peak and 45–75 seconds above 217°C, but the paste manufacturer’s data and component limits take precedence. Heavy boards may need longer equilibration; sensitive components may require a lower peak and tighter board ΔT.
What does time above liquidus mean in reflow soldering?
Time above liquidus is the measured duration for which a solder joint remains hotter than the alloy’s liquidus temperature, meaning the solder is substantially molten and able to wet the metallized surfaces, coalesce, release some volatiles, self-align components, and form the intermetallic interface required for electrical and mechanical connection.
For SAC305, TAL is measured above approximately 217°C. Many paste suppliers publish a 30–90 second range, while a centered production target may be narrower after process validation.
How many thermocouples are needed for SMT reflow oven profiling?
A practical thermocouple plan uses enough channels to measure the assembly’s hottest joint, coldest joint, thermally massive components, small fast-heating components, bottom-terminated devices, temperature-sensitive package bodies, and leading-versus-trailing board locations, rather than selecting a fixed channel count without considering thermal risk.
Six to ten channels are common for mixed assemblies, while dense power boards may need more. The measured locations and attachment quality matter more than the raw number of channels.
When should a lead-free SMT production line be reprofiled?
A lead-free SMT line should be reprofiled whenever equipment, materials, product design, loading, airflow, conveyor mechanics, thermal mass, component sourcing, or defect performance changes enough to alter heat transfer or reduce confidence that the approved solder-joint and package-body limits remain satisfied during normal production.
Typical triggers include heater replacement, blower maintenance, conveyor repair, paste changes, PCB revisions, new BGAs or connectors, fixture changes, line transfers, repeated AOI trends, and scheduled process-verification intervals.
Build a Reflow Process Your Production Team Can Defend
A reliable lead-free reflow profile is not the curve with the smoothest shape. It is the profile supported by traceable thermocouple data, centered process limits, realistic oven loading, controlled solder-paste deposition, and inspection results that remain stable over time.
Measure the board. Challenge the window. Connect SPI, reflow, AOI, X-ray, and test data.
Then freeze the recipe—not before.